Retrieving logs about a Connector
About this guideIn this guide, you'll learn how to retrieve logs of a specific configured Connector, which can then be used in many situations such as diagnosing an error or reconciling billing.
Extract logs using filters
Steps
1 - Access all logs
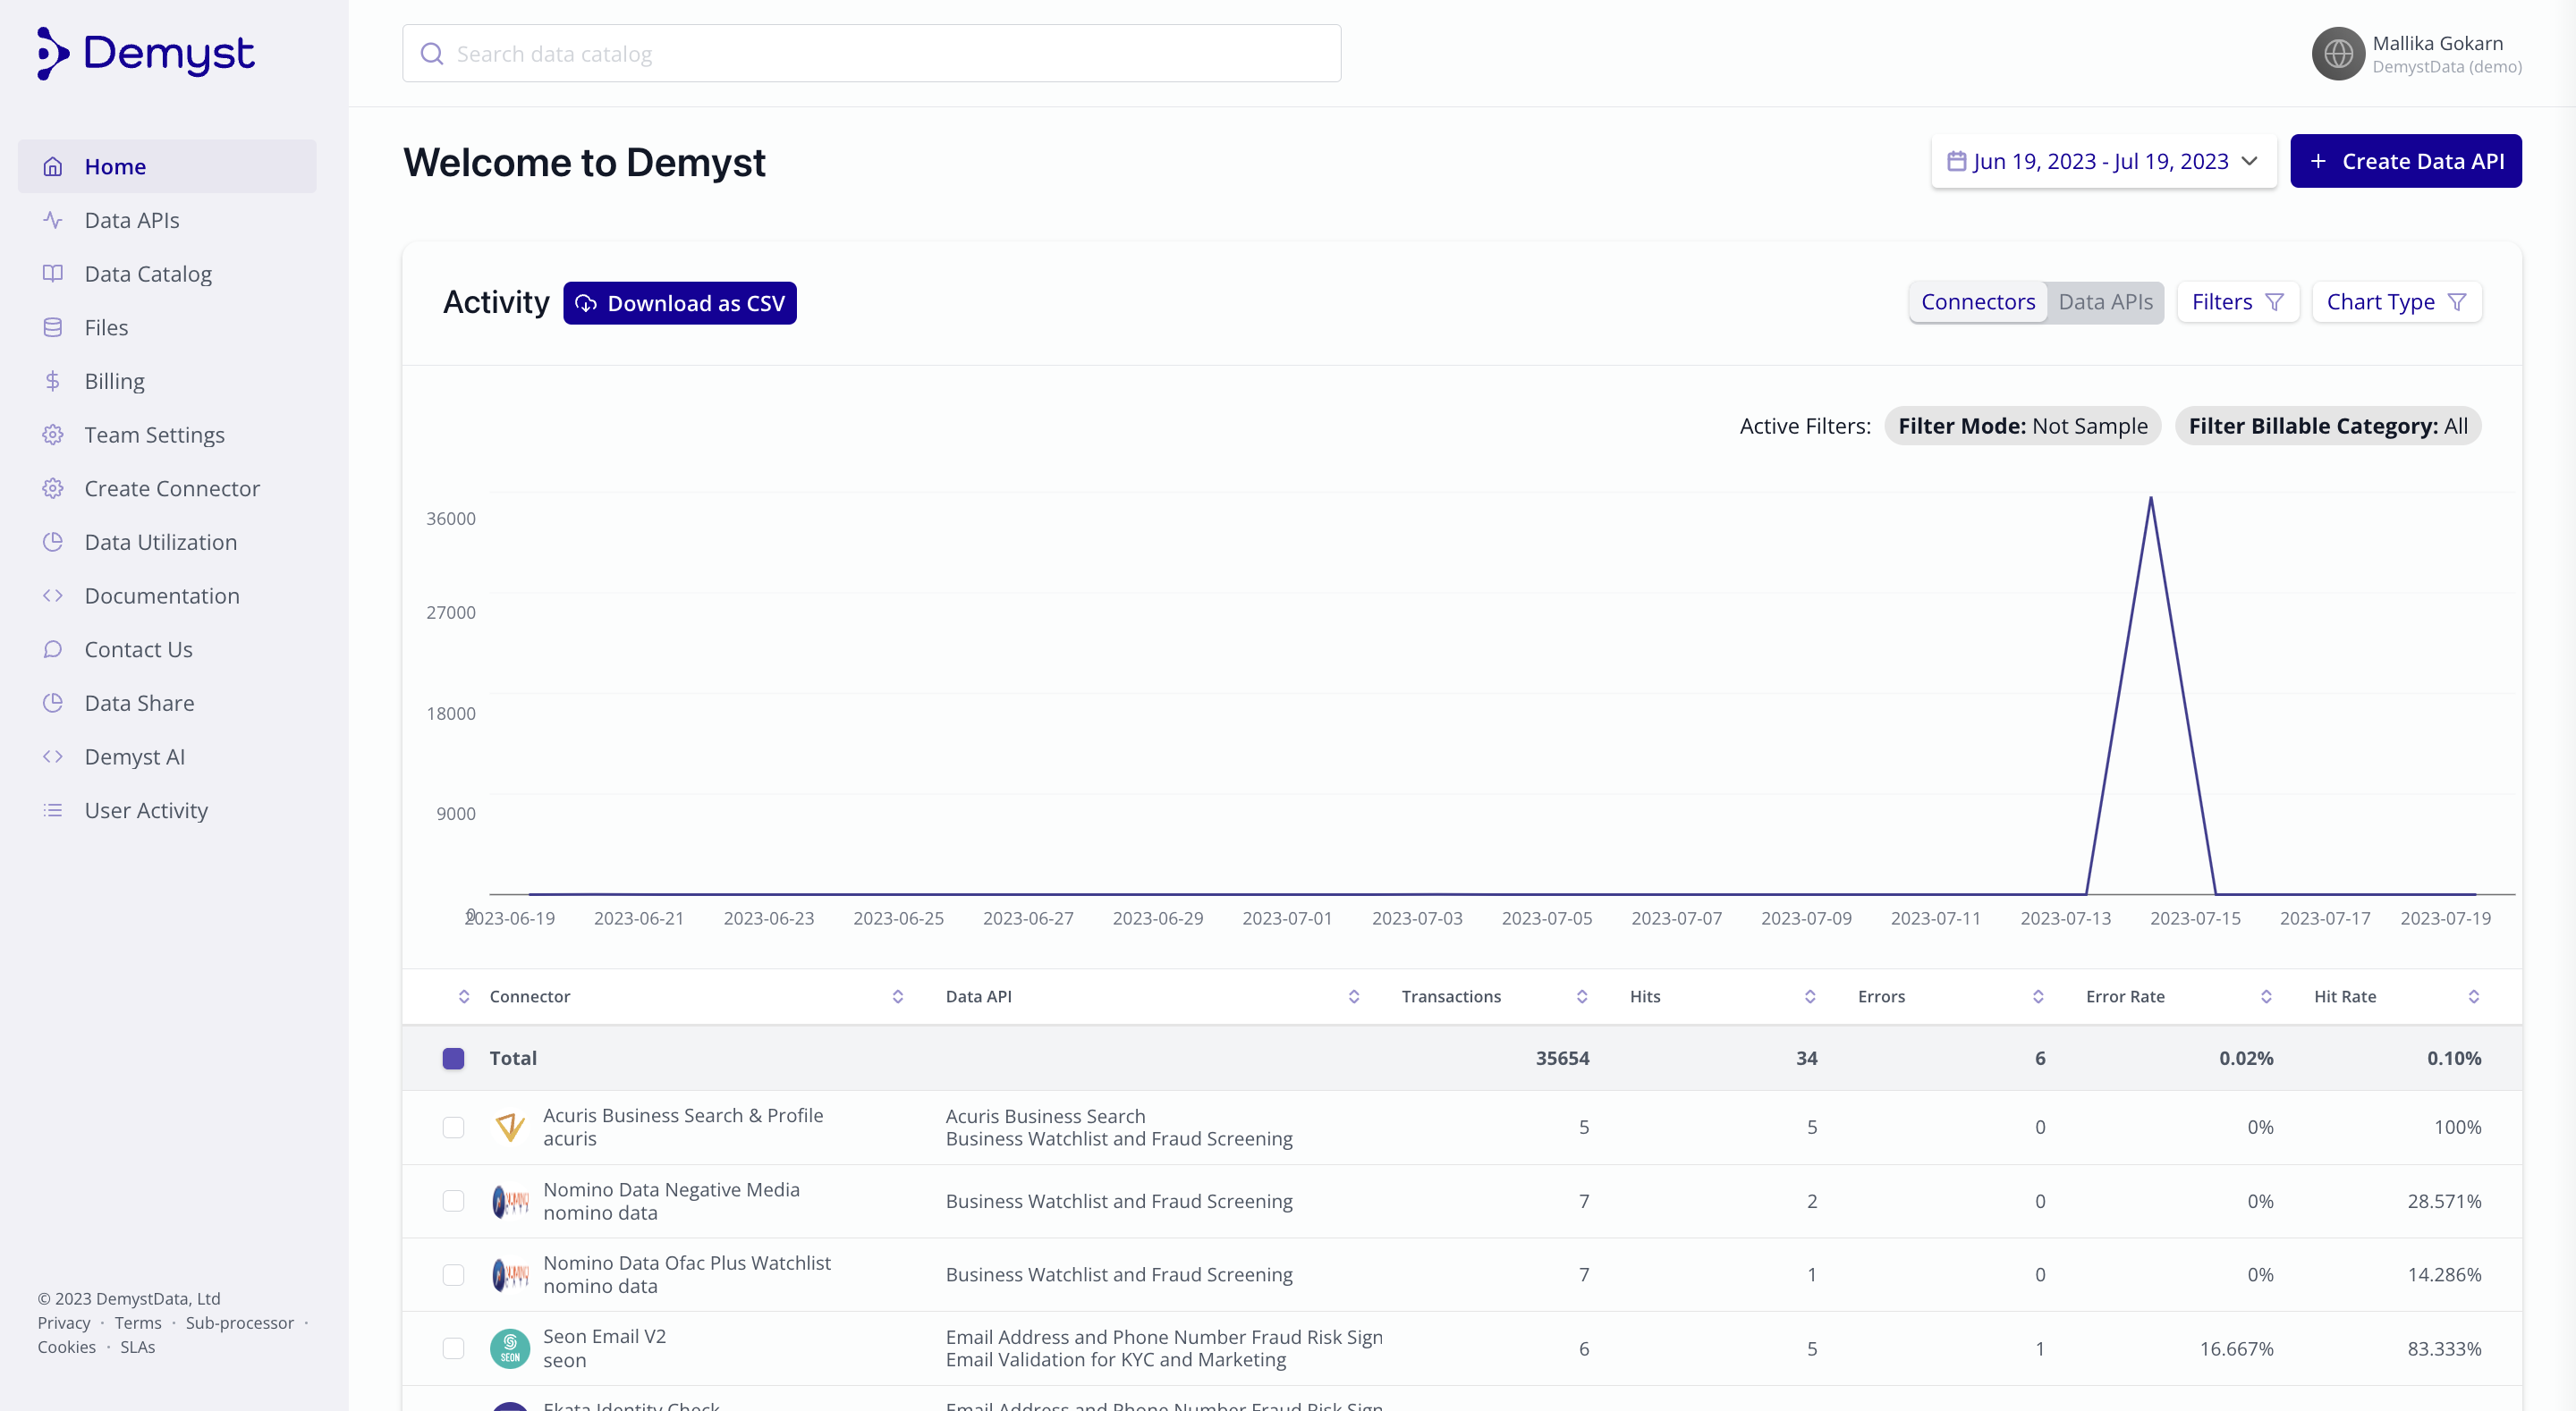
Demyst makes logs for your organisation accessible under the Home tab. Toggle between Connector and Data API setting to change the underlying logs data being fed into the line chart visualisation.

Step 1: Access all logs
2 - Filter through the logs
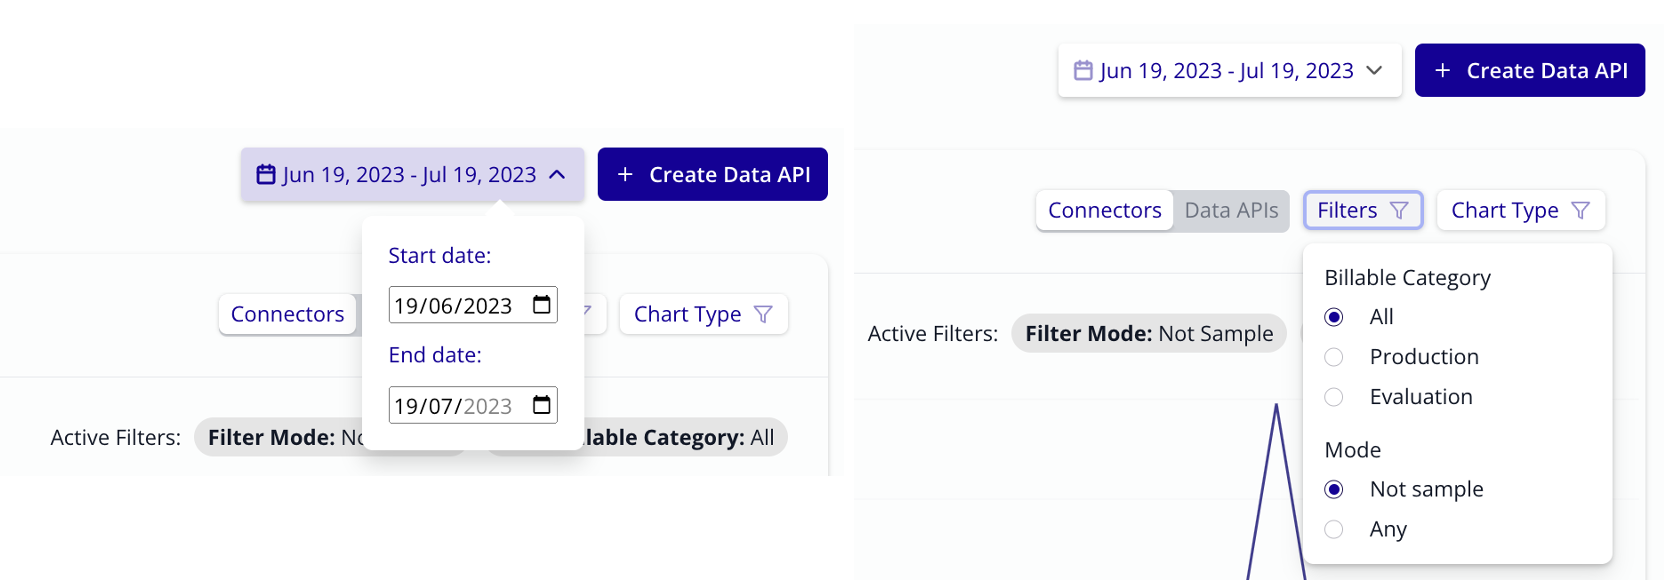
Use the filters to the top right of the chart to select the time period of interest, the execution mode, and the billable category.

Step 2: Use the filters to select the logs of interest
3 - Download the logs
Use the "Download as CSV" to retrieve the filtered logs for further examination.

Step 3: Use the download button to reconcile logs offline
(Optional 4) - Select the configured connector
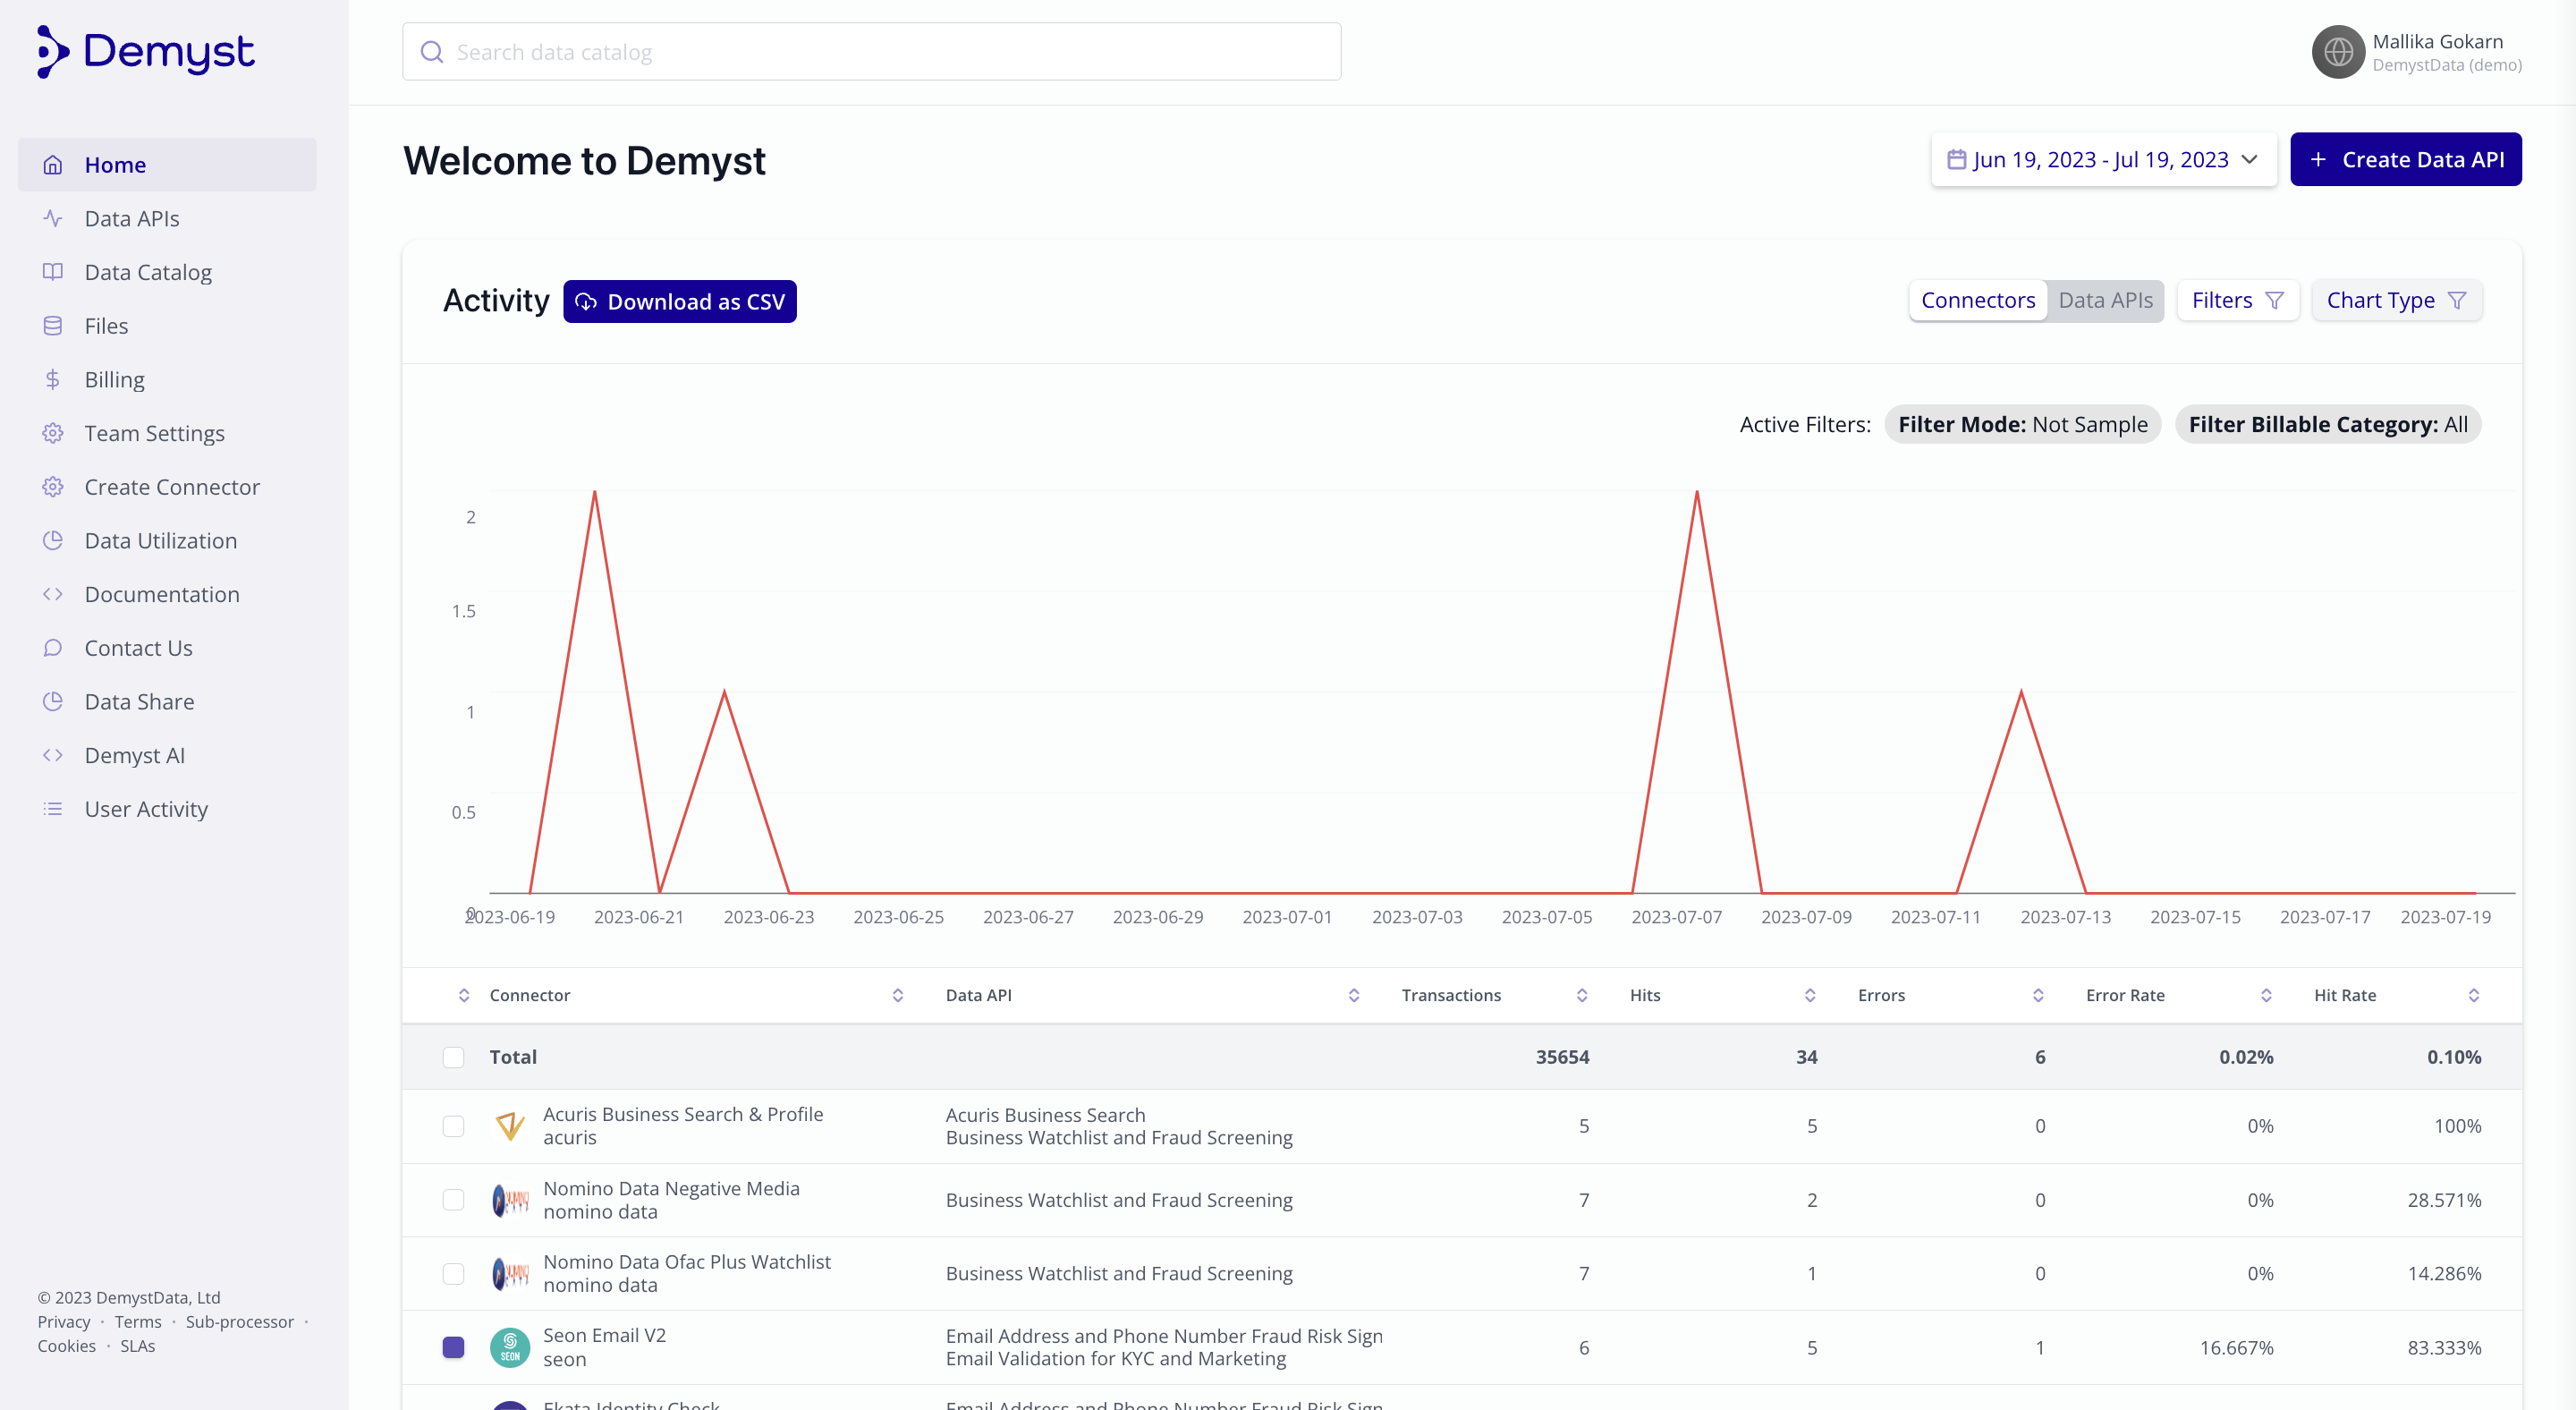
Scroll through the list of Connectors and Data APIs used in your organisation and use the checkboxes to select those you would like to examine. This will change the underlying data of the visualisation.

(Optional) Step 4: Select a subset of connectors for viewing
(Optional 5) - Change the chart type
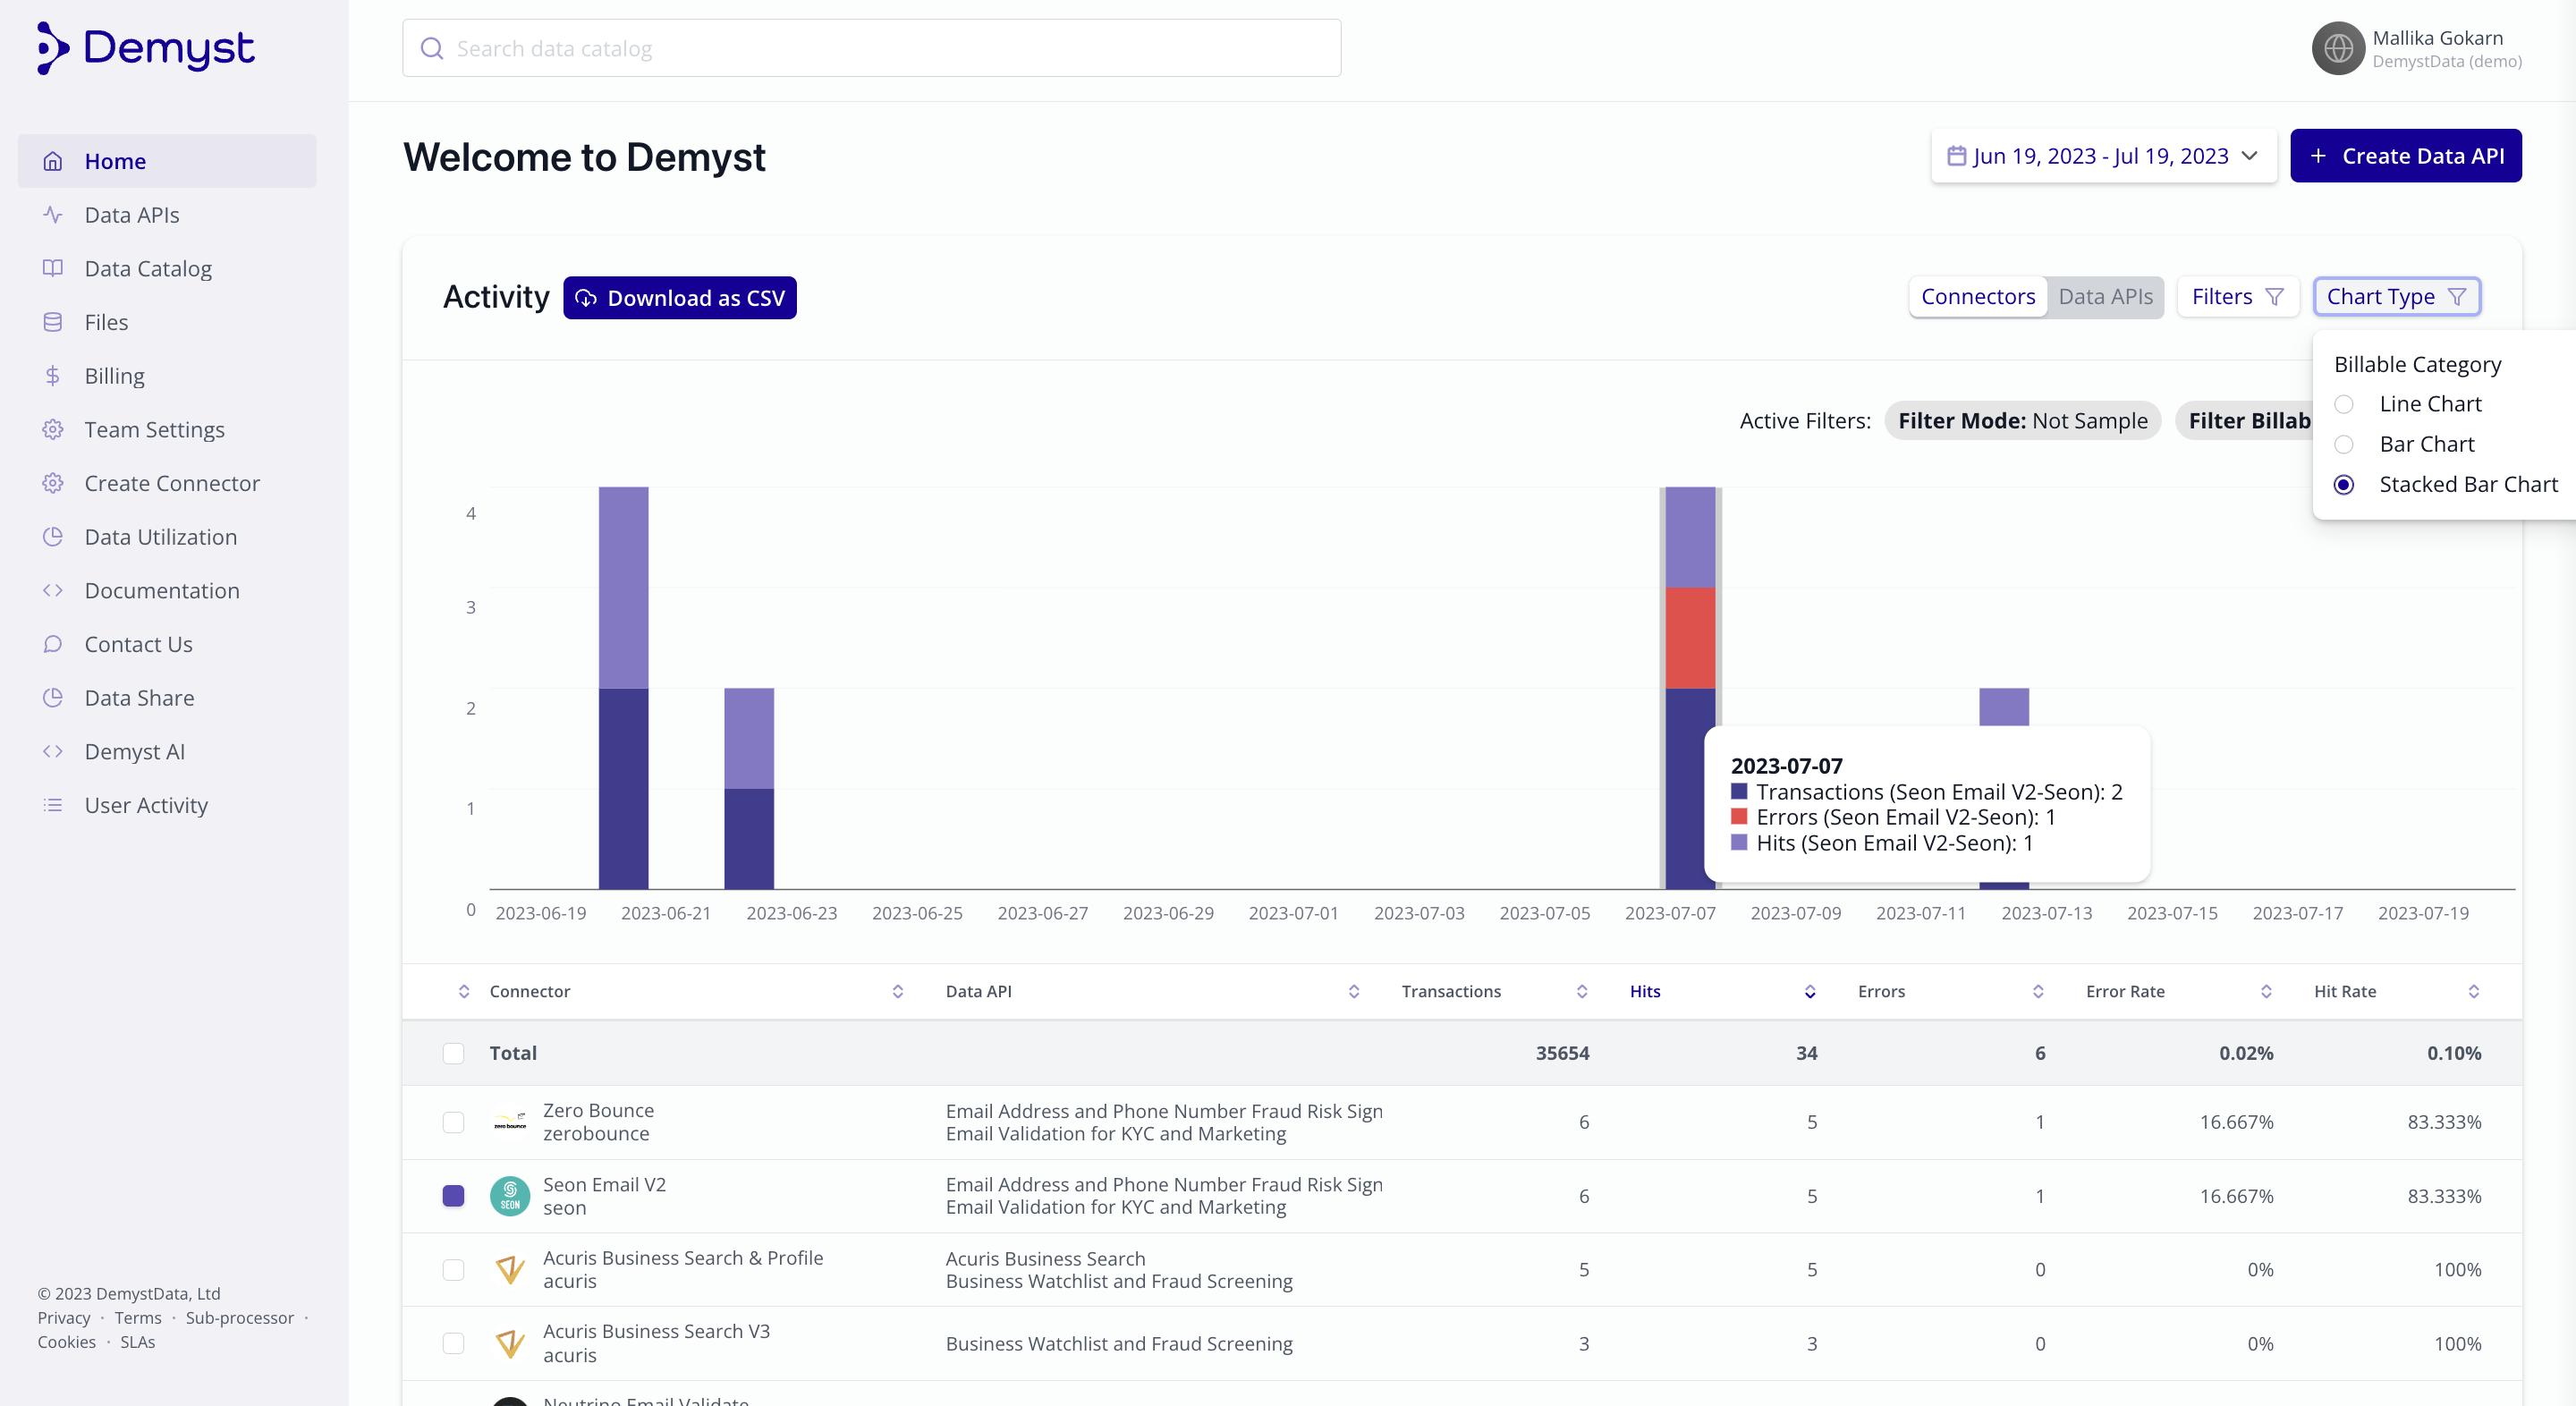
Use the "Chart type" filter to change the type of visualisation to your preference. A "stacked bar chart" visualisation will show a breakdown of transactions, hits and errors.

(Optional) Step 5: Change the chart type for a more enriched experience
(Optional 6) - Sort the table
Click on the arrows to the right of the table headers to sort the table. The below image shows the table sorted according to the highest error rate for my filtered selection of logs.

(Optional) Step 6: Use the arrows to sort through the logs
Extract logs through a recipe
Make sure to have a look at the below recipe to learn how to extract audit logs through a recipe.
Updated 7 months ago